Gold vs Silver in 2026: Industrial Demand, the Gold-Silver Ratio and Risk
Why gold and silver respond differently to real yields, industrial activity and supply, plus an illustrated guide to the gold-to-silver ratio and volatility.
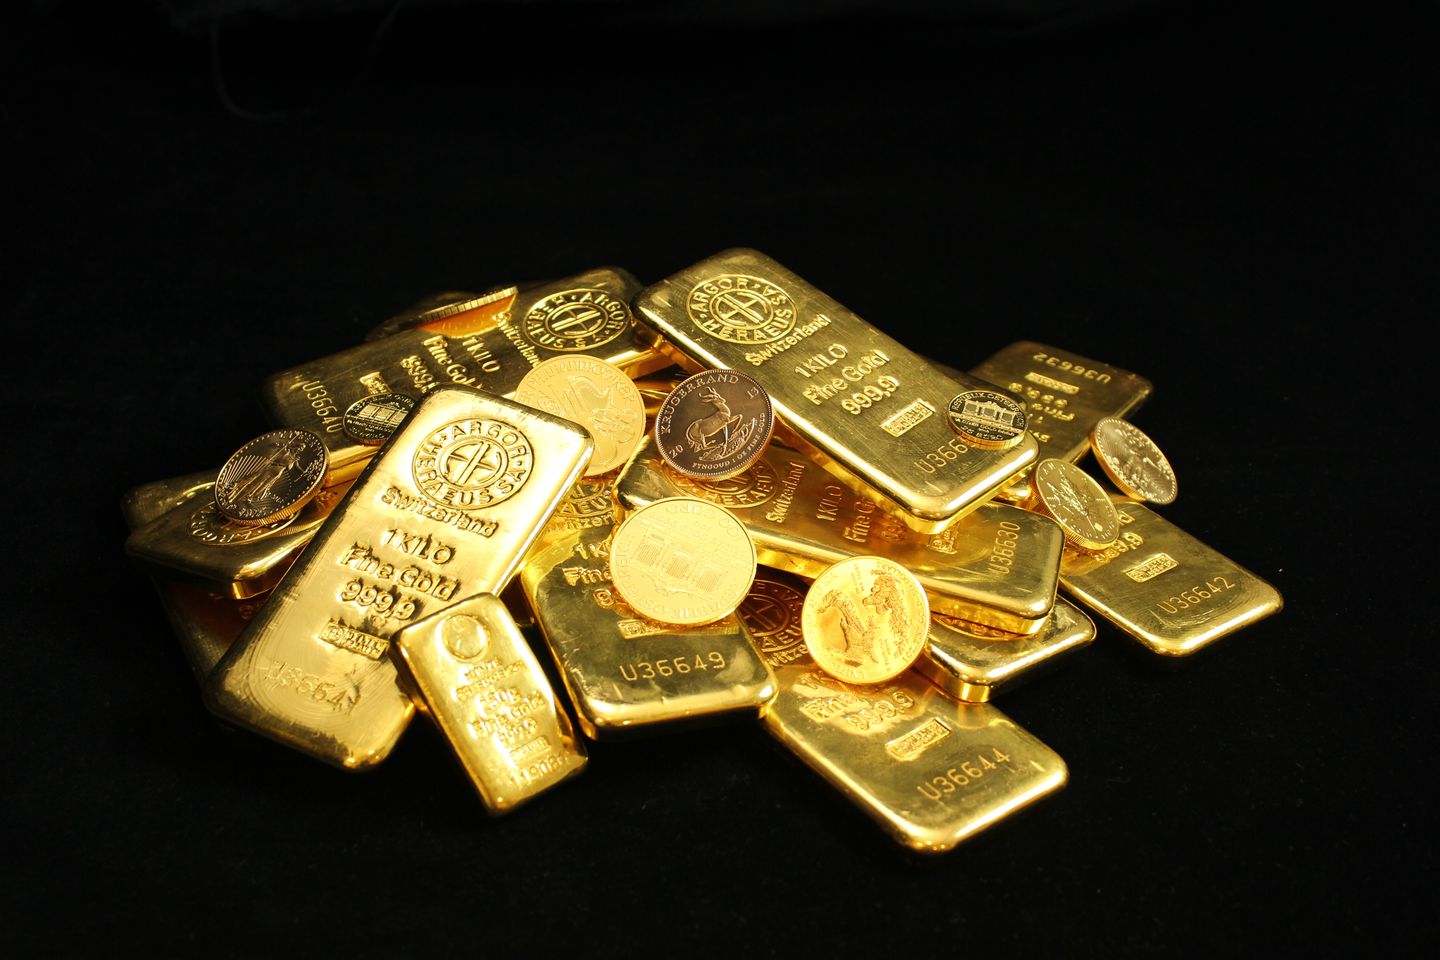
Gold and silver are related but not interchangeable
Gold and silver are precious metals quoted in global markets, yet their demand profiles and supply constraints differ. Gold is widely held as a monetary and investment asset, including by central banks, while silver combines investment demand with extensive industrial use. A change in expectations for interest rates can influence both, but manufacturing activity, electrical demand and industrial inventories may pull silver in a different direction.
The popular gold-silver ratio is a relative-price measure, not a promise that prices will converge to a historical average. Investors should understand what drives each metal before interpreting a high or low ratio as a signal. This guide focuses on mechanisms, risk and measurement rather than forecasting an exact price for XAU/USD or XAG/USD.
What the gold-silver ratio actually measures
The gold-silver ratio is usually calculated as the price of one troy ounce of gold divided by the price of one troy ounce of silver, using comparable currencies and timestamps. If gold hypothetically trades at $3,000 and silver at $30, the ratio equals 100. If gold remains unchanged and silver rises to $40, the ratio falls to 75. Those figures are illustrative only, not verified October 12, 2026 market quotes.
The ratio can move because gold rises, silver falls, both rise at different speeds, or both fall at different speeds. Its direction alone does not reveal which metal generated a positive absolute return. Someone trading a relative-value spread also faces financing, margin and potentially divergent volatility.
Comparisons must use consistent spot or futures references. An illiquid overnight quote, retail bullion selling price and active futures price can differ because of dealer premium, delivery terms and market structure. Mixing them creates a ratio that appears precise but is not analytically useful.
Why industrial demand makes silver distinctive
The US Geological Survey describes silver's conductivity, reflectivity and chemical properties and documents its use in electrical and electronic products, catalysts and other industrial applications. Industrial consumption introduces a demand component that responds to factory output, manufacturing technology and substitution economics.
Demand from a particular application can increase even as production processes use less silver per unit of finished product. A growing product category does not automatically mean proportional growth in silver demand. Design changes, recycling, substitution and inventory cycles can modify the link. Reporting should distinguish end-use forecasts from actual fabricated demand.
An economic slowdown might weaken some industrial uses while safe-haven demand supports precious metals. In that environment gold and silver can diverge. During an industrial upswing, silver may gain an additional source of demand, but investors can still lose if currency or real-yield movements dominate.
Gold's monetary and investment role
Gold is often viewed as a store of value or portfolio diversifier, though its market price is volatile and it does not provide contractual interest or dividends. Demand comes from jewelry, investment products, central banks and technology, with proportions changing across time. The World Gold Council provides research that can help readers identify these categories, while its figures should be checked for reporting period and methodology.
Real yields can matter because gold competes with interest-bearing assets. When inflation-adjusted yields rise, some investors may prefer securities that offer income. Yet this mechanism is not deterministic. Geopolitical uncertainty, official-sector purchases, currency expectations and investor positioning can offset it.
The US dollar is another influence because internationally quoted prices and investors' purchasing power are connected. A weaker dollar may be supportive under some conditions, but neither gold nor silver follows a permanent one-to-one relationship with the dollar index. Correlation should be measured over a defined window.
Why supply behaves differently from demand
Mine supply cannot instantly expand when the market price increases. Developing a deposit can involve exploration, permits, capital-intensive construction and years of lead time. Silver is also produced as a byproduct of mining other metals, which means its supply can respond to the economics of copper, lead or zinc rather than solely to silver's own price.
Secondary supply through recycling introduces another dimension. Higher prices can encourage more collection and refining of scrap, but recovery rates depend on material type, technology and economic incentives. Some silver embedded in tiny electronic components may be difficult to recover commercially.
Gold supply likewise includes new mine production and recycling, while above-ground stocks and investor behavior influence available metal. Comparing annual mine output without accounting for existing inventories and recycling can exaggerate supply scarcity.
Volatility and the meaning of a percentage move
Silver can experience large percentage price changes relative to gold, partly because its market characteristics and participant mix differ. A rise from $20 to $22 is a 10% increase, while gold rising from $2,000 to $2,100 is a 5% increase. The nominal dollar move is not a measure of relative volatility.
Analyze realized daily or weekly returns across a sufficiently long sample, including turbulent periods. Volatility rankings can change, and leverage or derivatives can greatly increase the loss relative to deposited margin. Neither metal is a guaranteed refuge from sudden market declines.
A leveraged silver CFD and physical gold bullion are not comparable investments. The former may involve rollover costs, spread changes and liquidation rules, while the latter includes dealer premiums, storage and insurance. A fair analysis normalizes instrument costs and holding period.
A hypothetical gold-silver ratio trade
Suppose a researcher thinks the ratio of 100 should decline. That can happen because silver outperforms gold, not necessarily because silver's spot price rises. A long-silver/short-gold trade may profit if silver holds up better during a broad precious-metals decline, but losses can still occur if the relative spread widens.
Choosing equal dollar positions does not guarantee market-neutral risk. The metals can have different volatility, contract multipliers and margin requirements. A relative-value strategy should estimate how much the ratio changes for plausible moves in each leg and what happens during unusually large divergences.
A simple stress table can consider gold up 5% with silver flat, both down 10%, or silver down 15% while gold falls 3%. Under those scenarios, the ratio may behave very differently. This exercise is more informative than declaring that any historical ratio is destined to return.
Physical bullion, ETFs and futures
Physical coins or bars involve dealer premiums to spot, buyback spreads, authenticity, storage and insurance. Exchange-traded products can provide more convenient access but introduce management fees, tracking considerations and fund-specific custody arrangements. Futures and leveraged contracts add margin, settlement or rollover characteristics.
Before selecting an instrument, inspect the precise legal structure and underlying exposure. Some funds hold physical metal, some may use derivatives, and some products are leveraged or inverse. A display showing a ticker with the word silver does not ensure direct ownership of particular silver bars.
Liquidity also varies across instruments and trading hours. A competitive exchange-traded fund may have narrower transaction costs for one investor than a small physical purchase; another investor may place greater value on direct possession despite higher expenses. The choice is practical and legal, not solely a forecast.
How to build a reproducible precious-metals dashboard
Record spot and relevant futures prices with timestamp, currency and data provider. Calculate the ratio using synchronized observations. Add changes in Treasury real yields, a broad dollar indicator, industrial activity data where available, and silver supply-demand figures with source period. Avoid implying a correlation from one dramatic trading day.
Distinguish forecast, preliminary estimates and final figures. Industry surveys can use revisions, and different organizations may classify metal uses differently. Comparing a 2024 annual mine estimate with a 2026 quarterly investment flow without context can produce false conclusions.
Make explicit what would change your interpretation. A sustained deterioration in industrial demand, unexpectedly strong recycling supply or sharp real-yield repricing might matter in different directions. A dashboard should help update probabilities rather than rationalize one fixed trade.
What to avoid in price forecasts
Be wary of forecasts that treat a historical high or low ratio as an absolute valuation boundary. Structural demand and market conditions can change. Claims that silver must immediately catch up with gold usually skip the timing problem and potential changes to industrial demand.
Avoid publishing undated charts as today's prices. When reporting actual intraday XAU/USD or XAG/USD zones, state the venue, timezone and observation time. Technical support and resistance are historical reaction areas, not guaranteed reversal points.
It is reasonable to identify conditional scenarios, such as stronger industrial growth alongside softer real yields. It is not responsible to present a precise target price as if uncertainty had disappeared.
Frequently asked questions
**Is silver always more volatile than gold?** Often it can be, but the comparison depends on period, instrument and market regime. Measure historical returns rather than assume a universal relationship.
**Does a high gold-silver ratio automatically mean buy silver?** No. Ratios can remain elevated or rise further when underlying demand or supply changes.
**What is one troy ounce?** It is the weight unit commonly used to quote precious metals. Use matching weights and currencies when computing the ratio.
**Can both metals fall during inflation?** Yes. Interest rates, the dollar, liquidity and expectations can outweigh a simple inflation narrative.
**Are bullion ETFs the same as owning physical coins?** No. Fund rights, fees, custody, redemption provisions and trading arrangements are different.
This is educational commodity analysis, not individualized investment advice or a prediction of live precious-metals prices.
Measure relative value without confusing units
Before calculating a gold-silver ratio, choose a common quote convention: both prices per troy ounce, both in US dollars, and both observed at the same time. If a data provider offers gold futures in one contract month and silver spot prices from an earlier settlement, the calculation can reflect basis and timing effects. For a historical study, use a consistent daily fixing or matched settlement series and document gaps and holiday rules.
Consider a hypothetical move from gold $2,500 and silver $25 to gold $2,600 and silver $26. Both prices increase 4%, so the ratio remains 100. A social post might claim that silver is catching up because its nominal price rose, but proportional relative performance did not change. Now suppose gold falls to $2,400 while silver stays $25. The ratio drops to 96 even though silver produced no positive return. Relative outperformance and making money are separate concepts.
The starting ratio may also respond to structural supply and demand factors that persist for years. A statistical mean calculated over twenty years is not an equilibrium enforced by a market maker. The metal relationship does not have a guaranteed redemption arbitrage that forces convergence.
Silver supply and byproduct economics
Silver frequently emerges from mines whose principal economics relate to other metals. A silver price rally may not make operators expand capacity if their capital decision depends mostly on copper, lead or zinc demand. Equally, higher production of a base metal can increase byproduct silver output even if silver prices are stagnant.
To evaluate an apparent shortage, compare mine supply, recycling, fabrication demand and inventory flows using clearly dated sources. Physical market shortages can be localized to a specific bar type, geography or delivery schedule rather than imply that no silver exists. Industrial users may draw inventories down temporarily, which can later affect reported purchasing patterns.
Manufacturing productivity can alter metal consumption. A solar technology using less silver per component may offset some demand growth from higher installation volume. Avoid multiplying a forecast for new hardware units by an old usage assumption without updating the material intensity.
Portfolio stress examples
Imagine a portfolio divided equally between unleveraged gold and silver products. If gold falls 3% and silver falls 12%, the portfolio declines approximately 7.5% before fees, assuming no rebalancing and equal initial values. If gold rises 5% while silver falls 10%, the combined return is approximately minus 2.5%. These examples show that holding two precious metals does not automatically provide strong diversification.
An investor looking for inflation protection should also examine the timing of liabilities and whether the chosen instrument offers liquidity when needed. A gold ETF, allocated bars, mining shares and leveraged futures express different economic exposures. Mining-company shares add management and corporate risks and are not interchangeable with holding metal.
Stress calculations should include bid-ask costs and any currency conversion if the investor measures wealth outside US dollars. In thin or volatile markets, execution costs can expand at precisely the time someone wants to reduce a position.
A careful conclusion on the ratio
The gold-silver ratio is best used as a question generator. If it moves sharply, ask whether the driver was industrial silver demand, monetary demand for gold, funding conditions or temporary positioning. Trace the explanation to evidence rather than choosing whichever story sounds most dramatic.
No single ratio threshold establishes a risk-free trade. A transparent report should include the dates, source and quote conventions, the returns of each metal, and the risks associated with the investment vehicle. That makes the metric useful without turning it into a prediction disguised as arithmetic.
Reporting sources & references
These links identify the reporting or public materials on which the article is based; they do not imply our newsroom witnessed the events.
Cite this report
RecoupRev Editorial Research. “Gold vs Silver in 2026: Industrial Demand, the Gold-Silver Ratio and Risk.” RecoupRev, October 12, 2026. https://recouprev.com/article/oct12-gold-vs-silver-ratio-industrial-demand-investment-risk